

SHIPPING POLICY
After done with your purchase of TRADER BOT indicator ,you have to provide us your trading view username or mt4 account number by :
support@traderbot.store
and our team will provide your access within 24 hours.
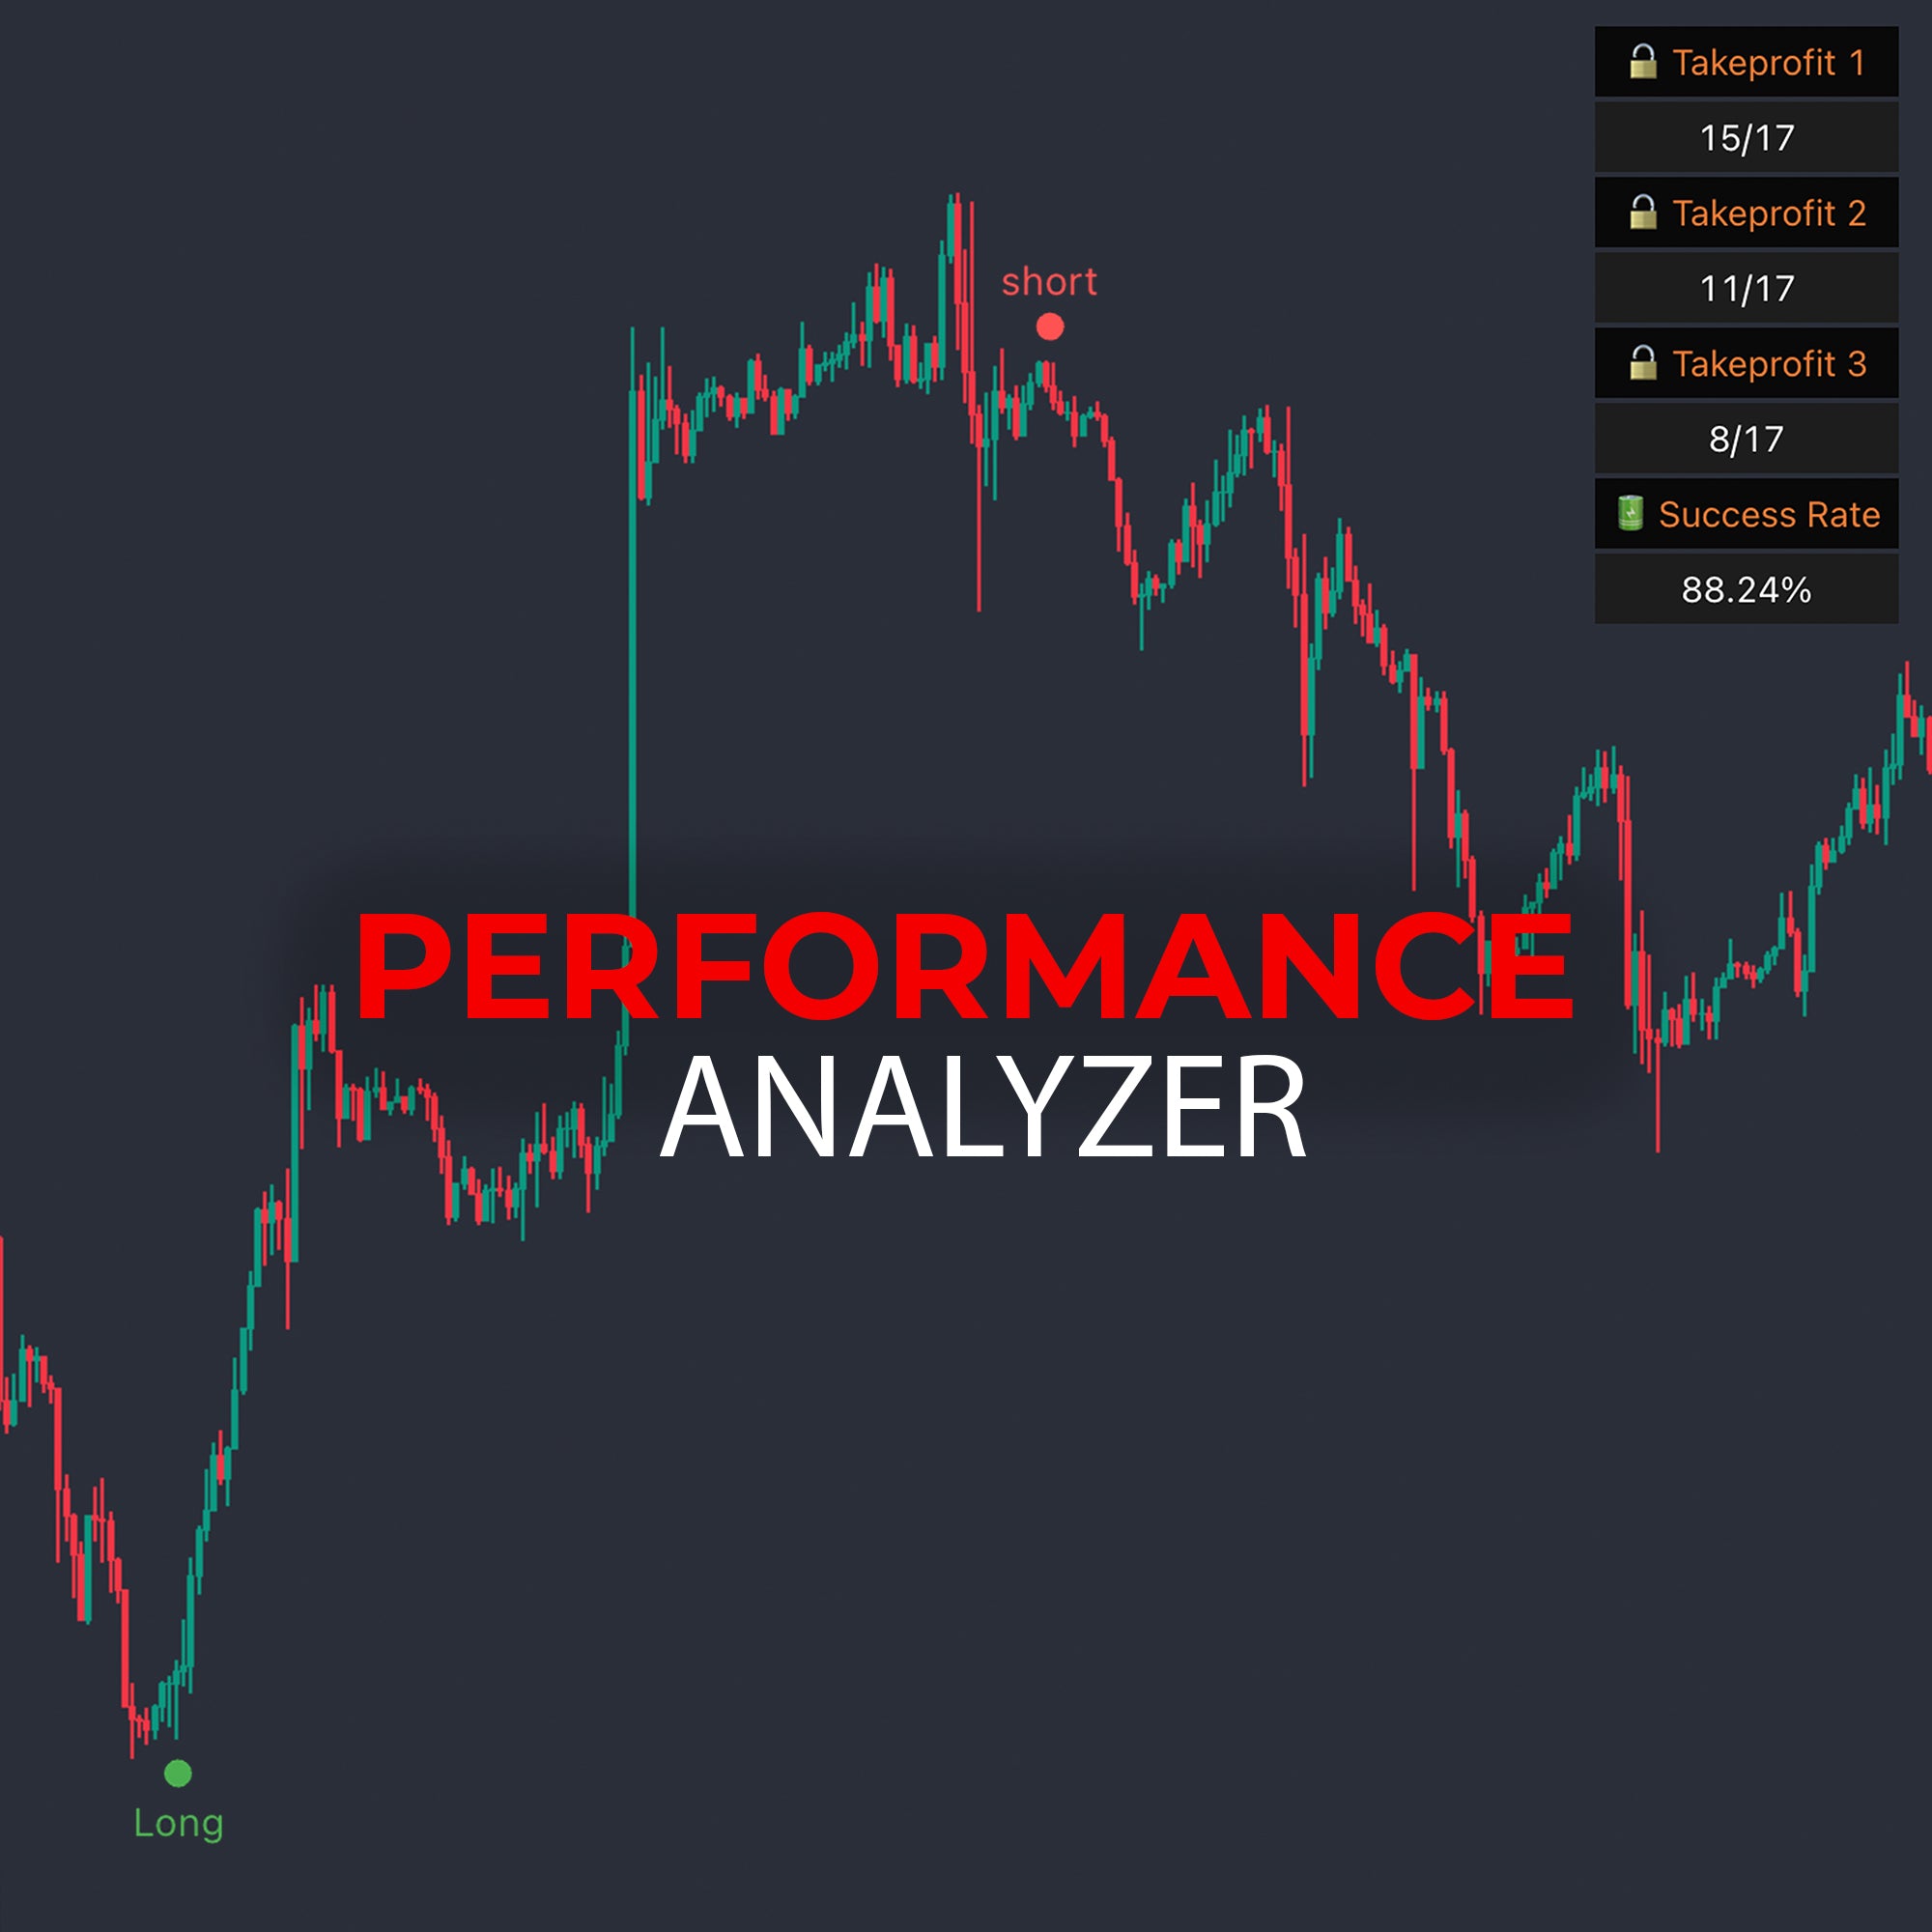
Performance Analyzer
Performance Analyzer is a versatile indicator that generates signals and offers a backtesting strategy. Users can customize settings and analyze results on the dashboard to identify optimal strategies for their charts. It allows users to select specific time periods for backtesting and evaluate performance effectively.
Default take-profit levels set at 0.3%, 0.6%, and 0.9%, with Smart dynamic stop-loss adjusted per entry using market momentum and the Average True Range (ATR).
(This indicator is available on all plans since 14 Oct,2023)
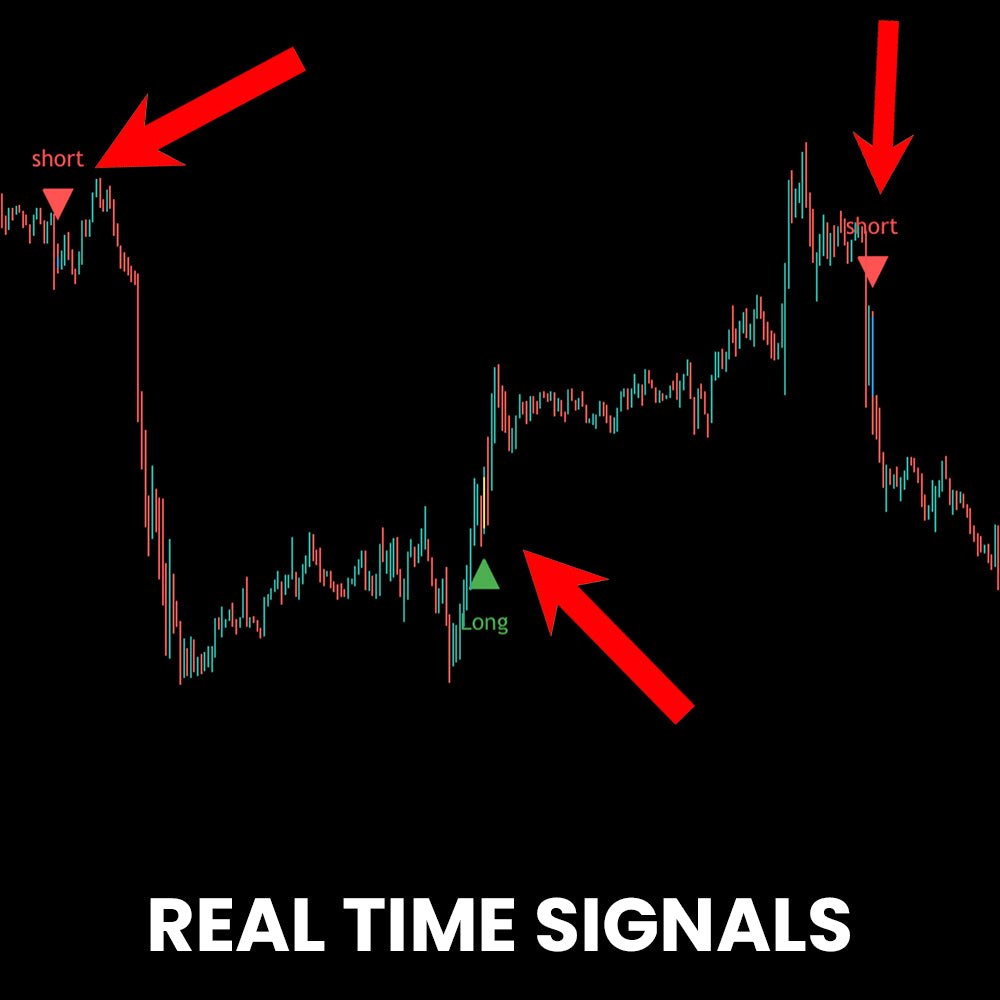
SWITCH PRO SIGNALS
The indicator quickly identifies market trends with visual buy/sell alerts on the chart. Useful on any timeframe even for 1 minute scalping.
This Indicator includes standard Buy and Sell signals on the chart, based on the current market direction

TAKEPROFIT / STOPLOSS
This indicator calculating values of entry, take profit and stop loss Automatically.Default take-profit levels set at 0.3%, 0.6%, and 0.9%, with dynamic stop-loss adjusted per entry using market momentum and the Average True Range (ATR). its fully customisable in setting, 3 green lines are takeprofit levels, red zone is stoploss zone ,Blue line in middle is entry price.
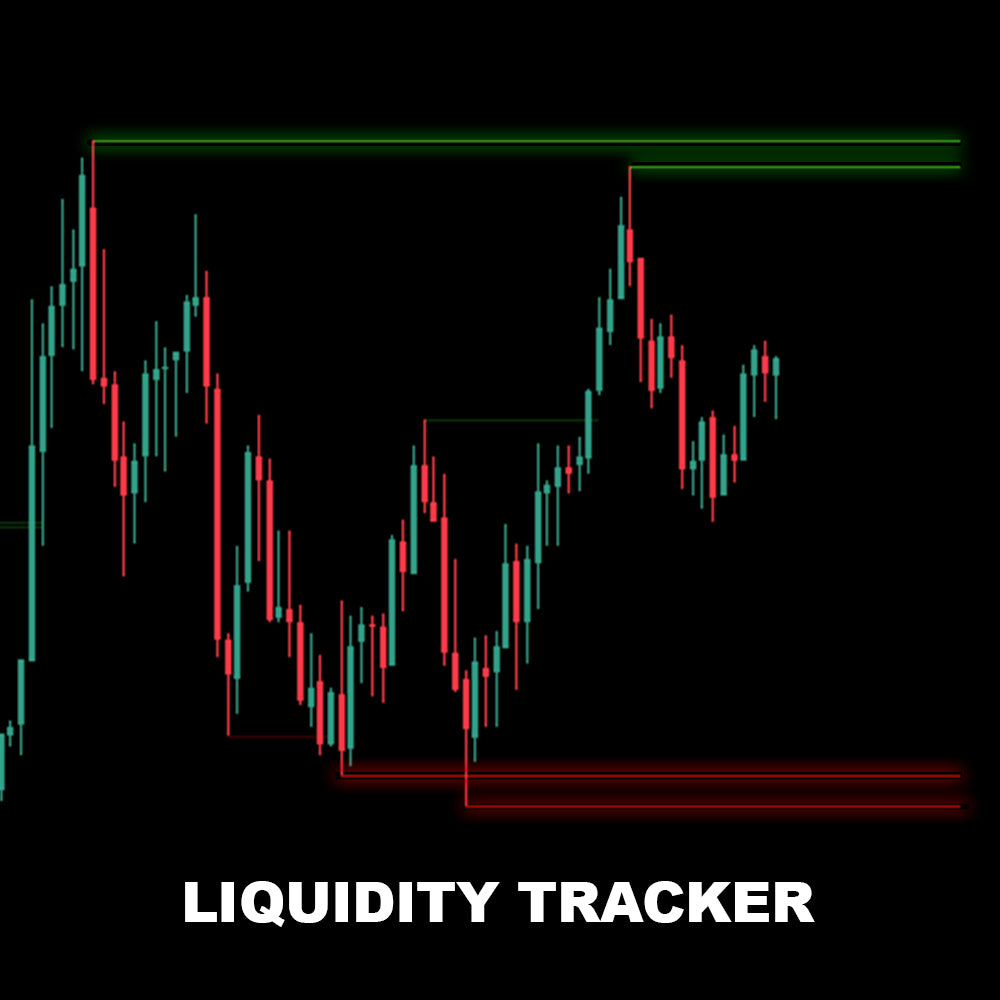
LIQUIDITY TRACKER
This feature tracks liquidity levels in the market, identifying areas with concentrated trading activity. It helps traders understand where significant buy or sell orders are placed, offering insights into market sentiment and potential price movements.
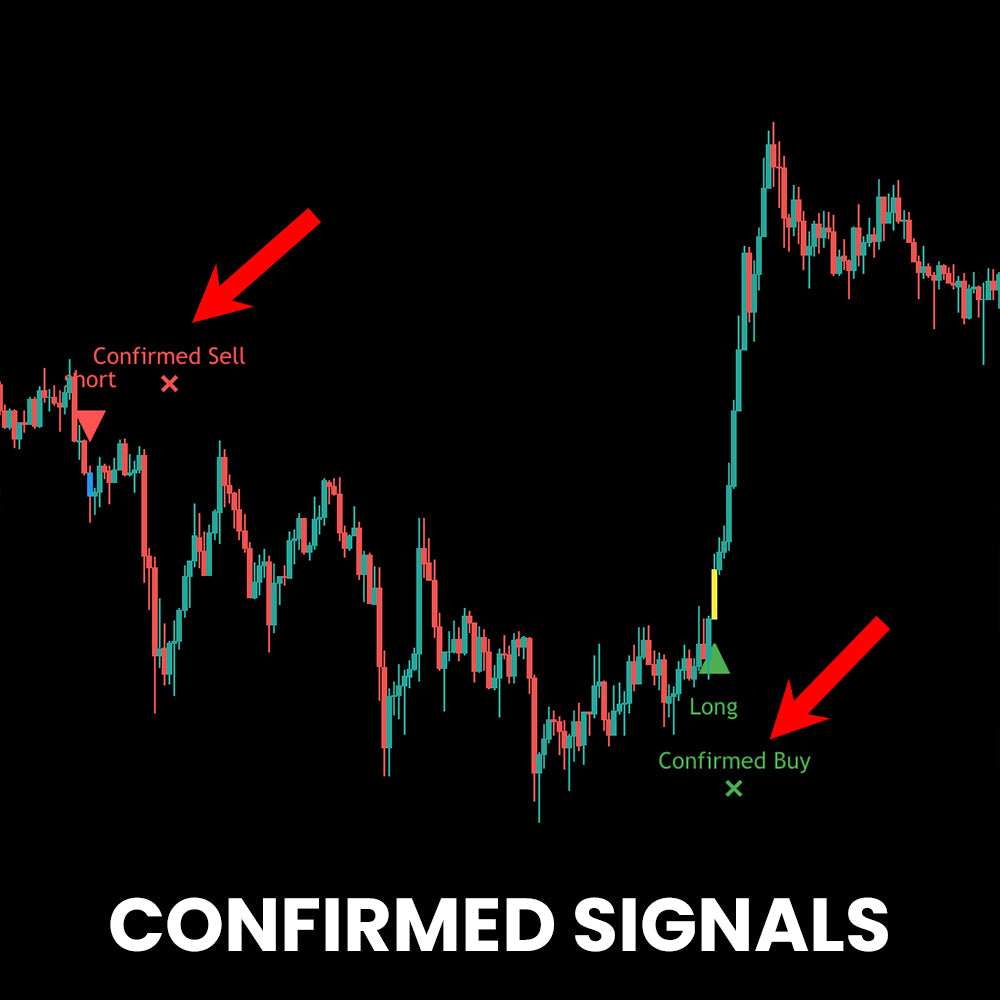
CONFIRMED SIGNALS
Confirmation signals are signals based on a trend following methodology. As the name suggests, they aim to confirm any potential action a trader might take and are more effective when used in confluence with other
indicators.

OVERTRADE ZONE
The Overtrade feature assists traders in recognizing overbought (suggestive of potential reversals) and oversold (indicative of potential trend changes) conditions in financial markets through the analysis of price and momentum data. These zones are activated when RSI falls below 30 (signifying an oversold condition) and rises above 70 (signifying an overbought condition). However, it's crucial to understand that overbought and oversold zones do not serve as entry signals but rather as tools for chart analysis.
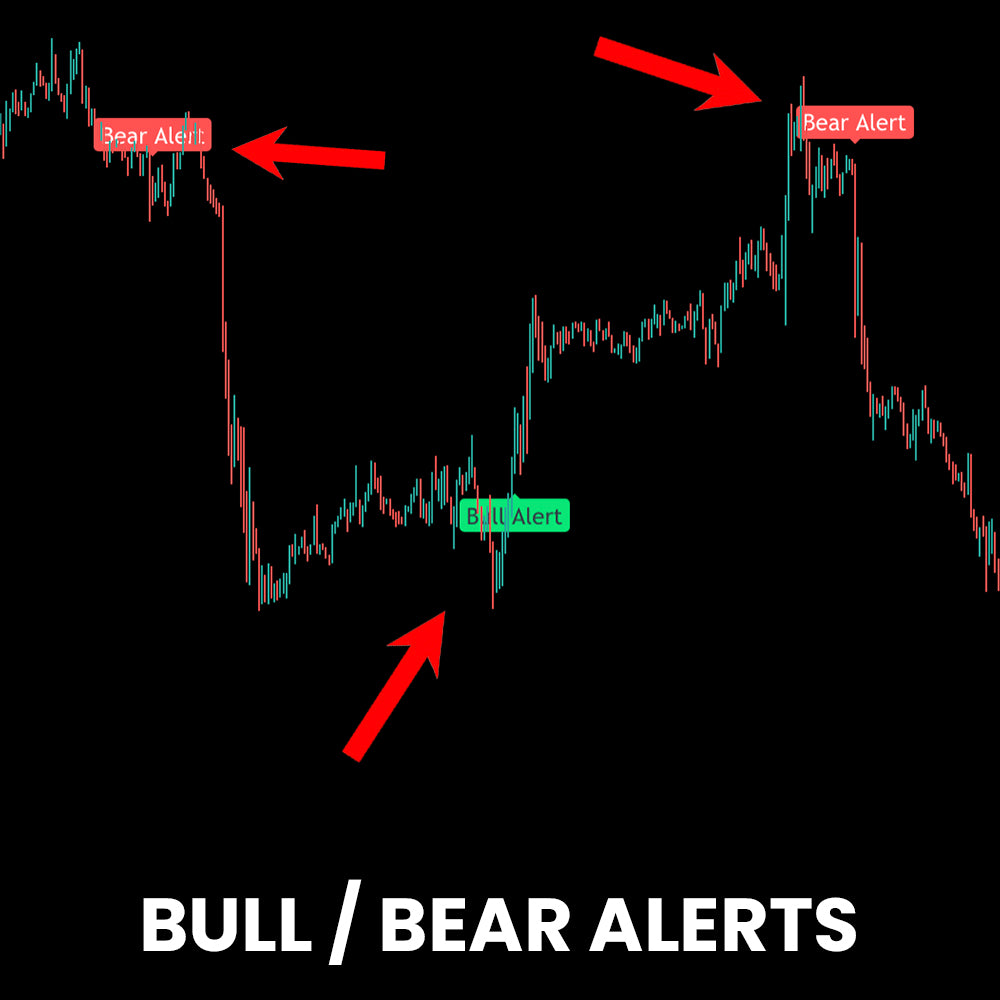
BULL/BEAR ALERT
A bullish/bearish candle pattern informstraders that the market is about to enter an uptrend/downtrend after a previous decrease/increase in prices. This reversal pattern is a signal that bulls/bears are taking over the market and could even push the prices up/down further – marking the time to open a long position.

BREAKOUT INDICATOR
This indicator displays breakup & breakdown candles with green and red labels, breakout is a stock price moving outside a defined support or resistance level with increased volume.

SR/TP INDICATOR
This feature can be activated to draw the key levels of Support and Resistance easing your decision making and reinforcing the entry signals. Those levels can also be used as Stop Loss or Take Profit.

MARKET INFO
This dashboard shows current market's information in a single panel with Real-time data.market info sticks to the last candle on the chart.

AUTO TREND LINE
Auto Trendlines display a series of trendlines on the chart, these
can highlight points of support or resistance depending on the
current price trend.as trendline needs collecting enought data to draw lines it's better to use it on higher timeframes.
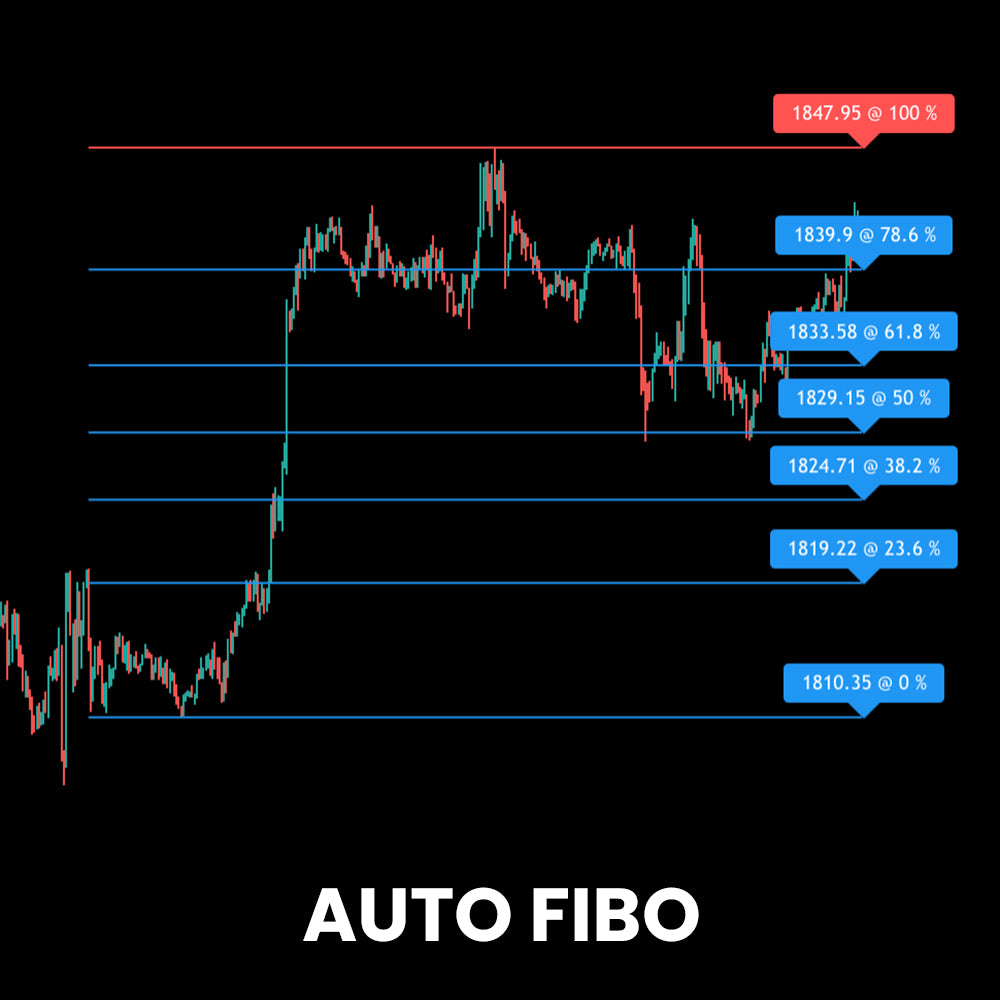
AUTO FIBO
Ideal educational tool and guide for new traders looking to practice drawing Fibonacci retracements.Automatically drawn Fibonacci Retracement Levels Corresponding labels for each level (Price & Level).
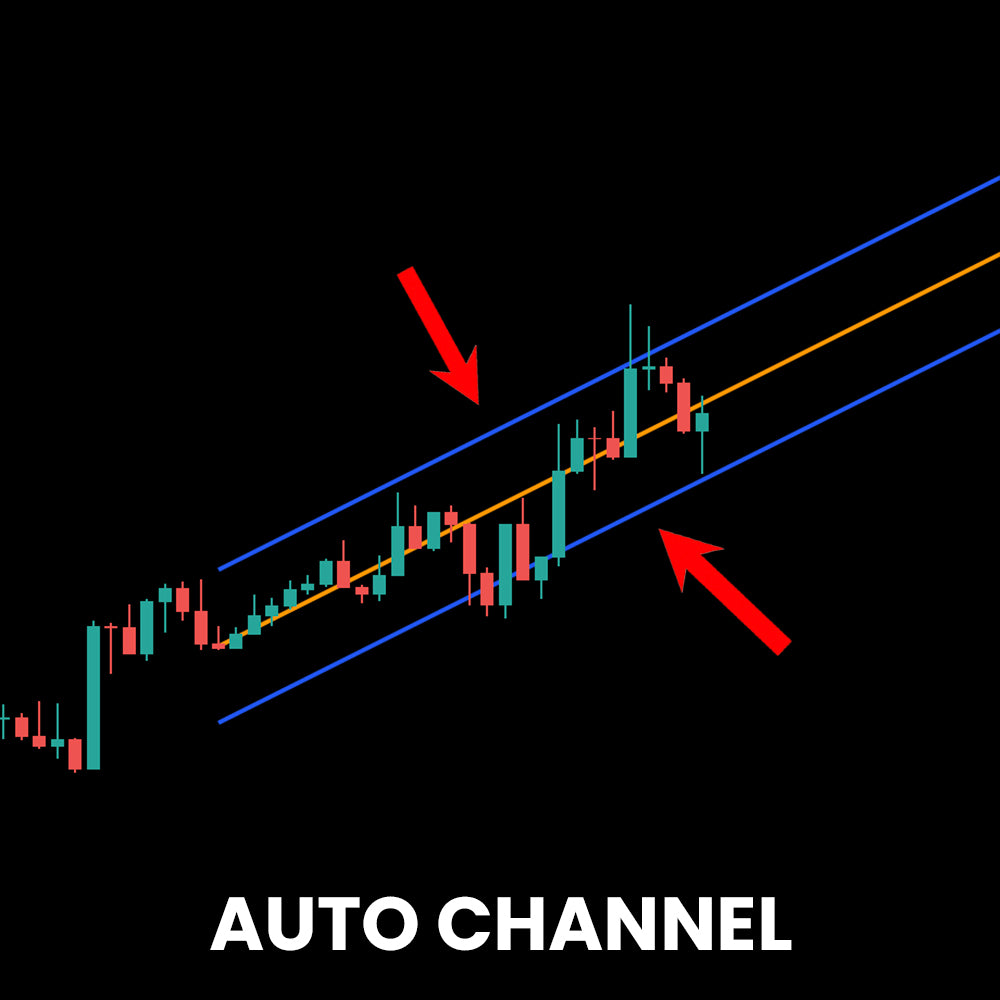
AUTO CHANNEL
Channels are including an upper and a lower line, at equal distance from a middle line. The area between
those lines is the channel. They are commonly used for daily periods but work for any period.
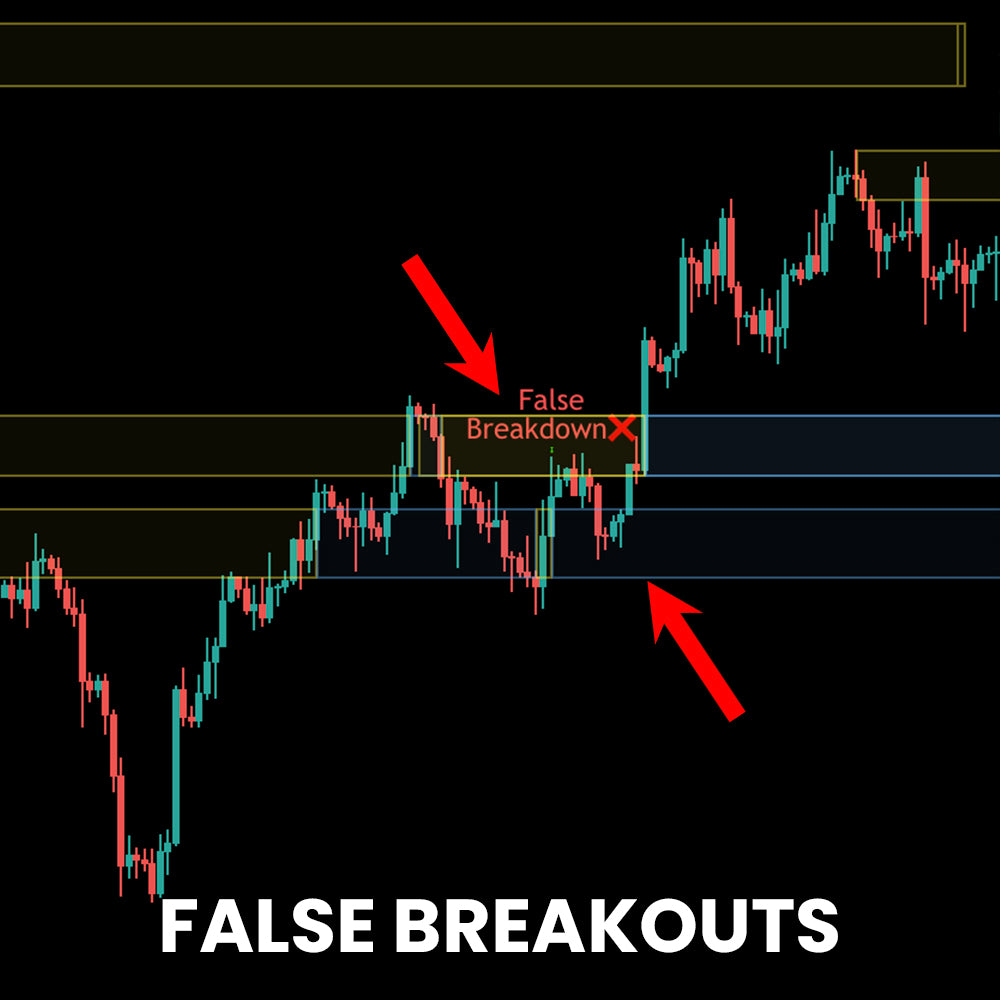
FALSE BREAKOUTS
False breakout patterns are one of the most important price action trading patterns to learn, because a false-break is often a very strong clue that price might be changing direction or that a trend might be resuming soon.
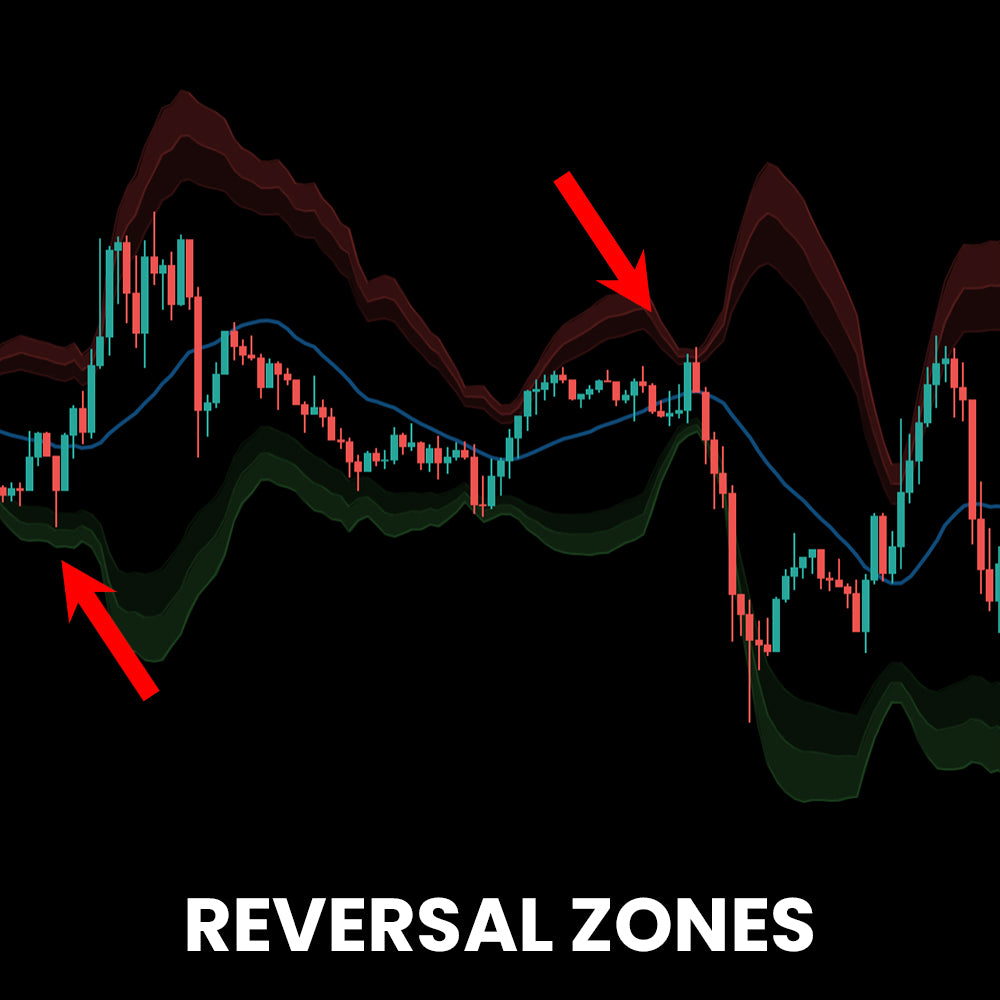
REVERSAL ZONES
When enabled, one upper and one lower zone will be displayed on your chart, each zone is designed to help the user find tops and bottoms whether the market is ranging or trending (however the indicator will still be more effective during ranging markets).These zones can be great areas to take profit or find early entries to use alongside the confirmation or contrarian signals.
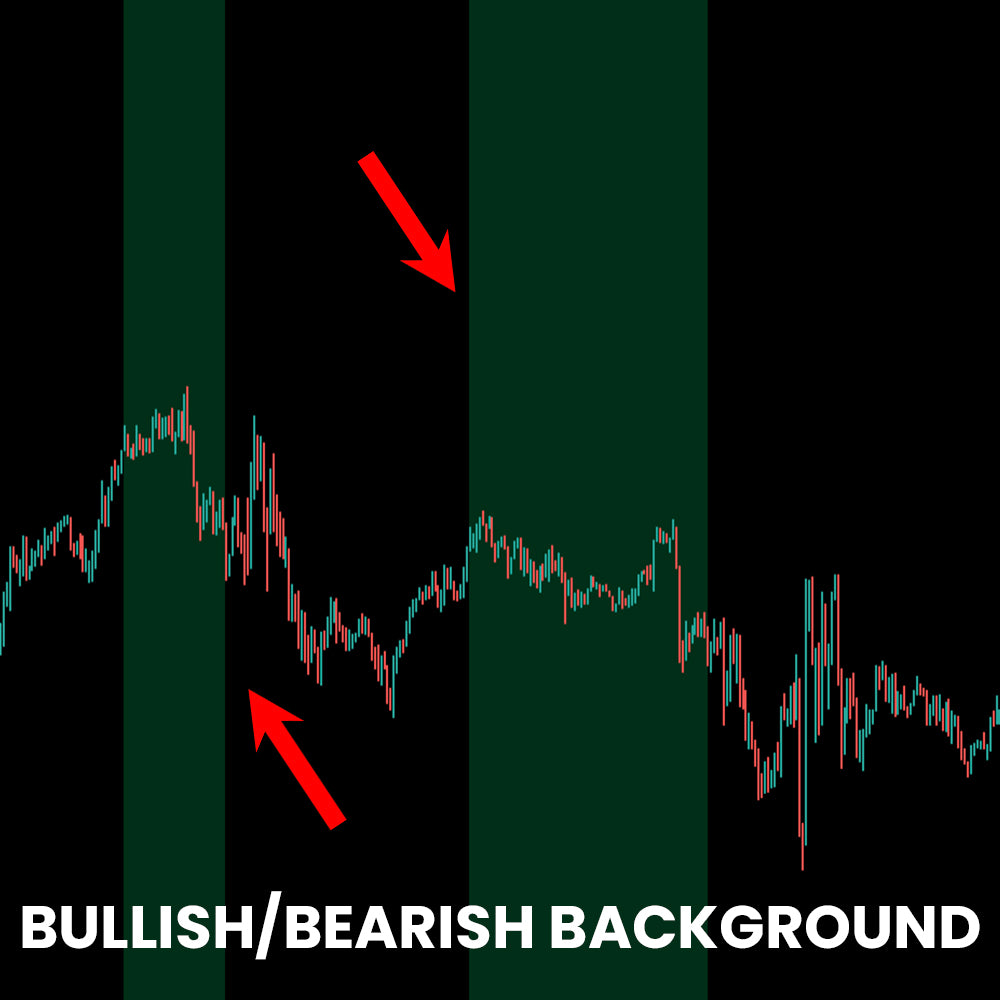
TREND BACKGROUND
This indicator shows the bullish and bearish background of market,when market is bullish it turns to green and the other part is bearish.
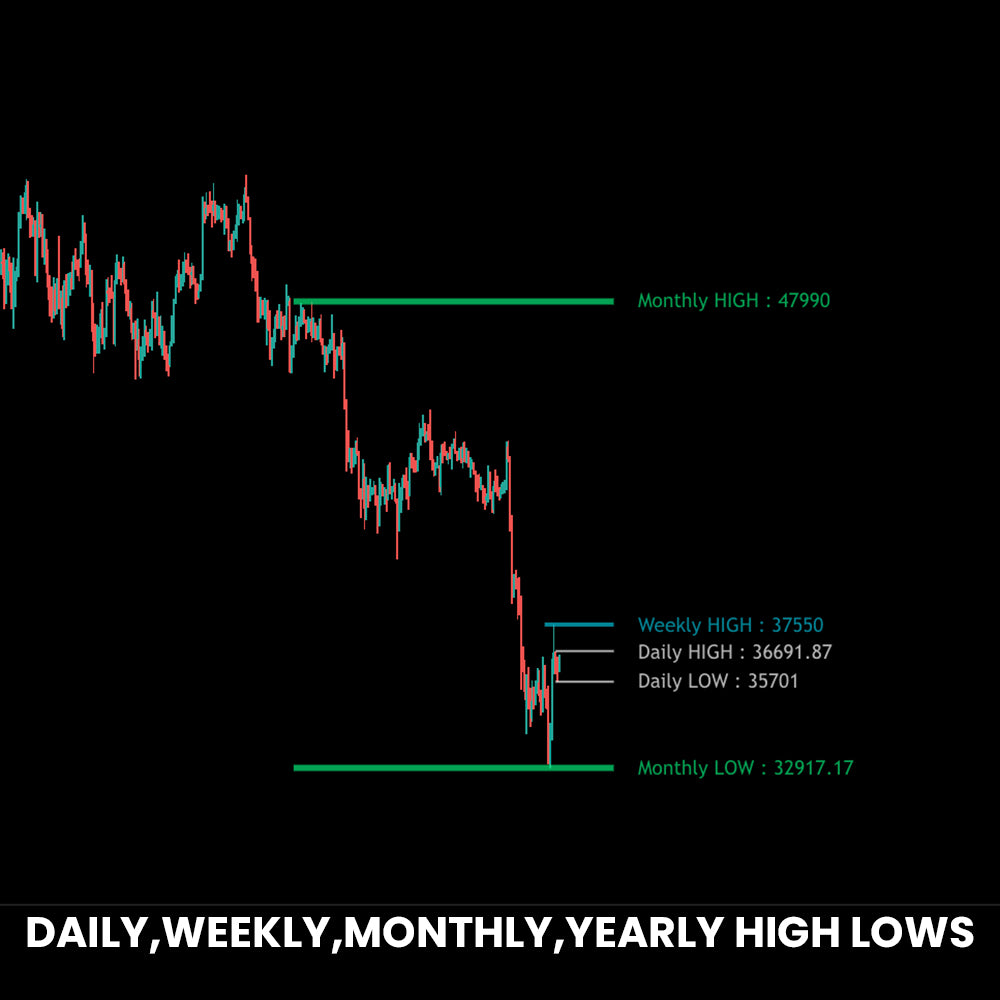
HIGH AND LOWS
The market open matters becauseinformation from overnight and international markets will be absorbed and acted upon. The opening volume must be compared to the opening volume of other trading days, not to the remainder of the same trading day. Increased volume generally indicates increased volatility.
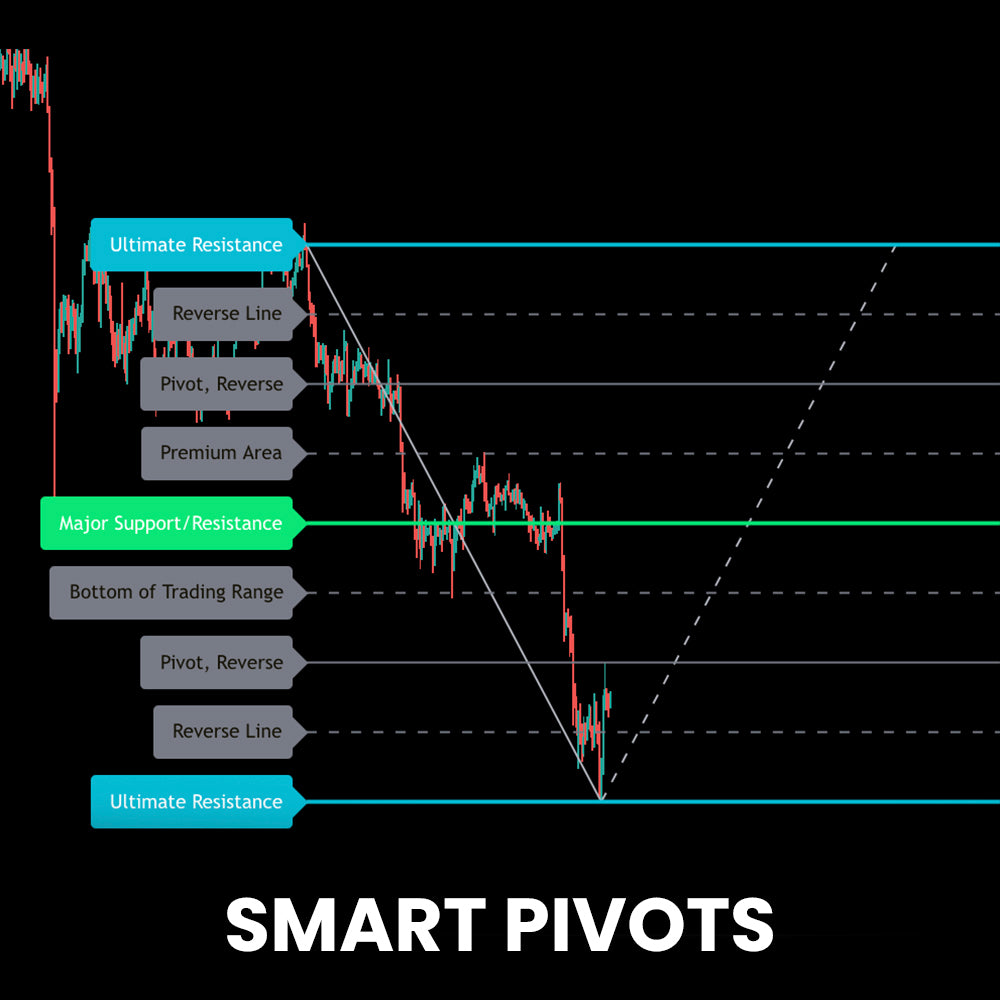
SMART PIVOTS
The SMART PIVOTS Lines are part of SMART PIVOTS trading system. SMART PIVOTS Lines are similar to Fibonacci retracements. These lines consist of 9 equidistant lines which are parallel to each another. SMART PIVOTS Lines from the bottom are at the levels 0/8, 1/8, 2/8, 3/8, 4/8, 5/8, 6/8, 7/8 and 8/8.
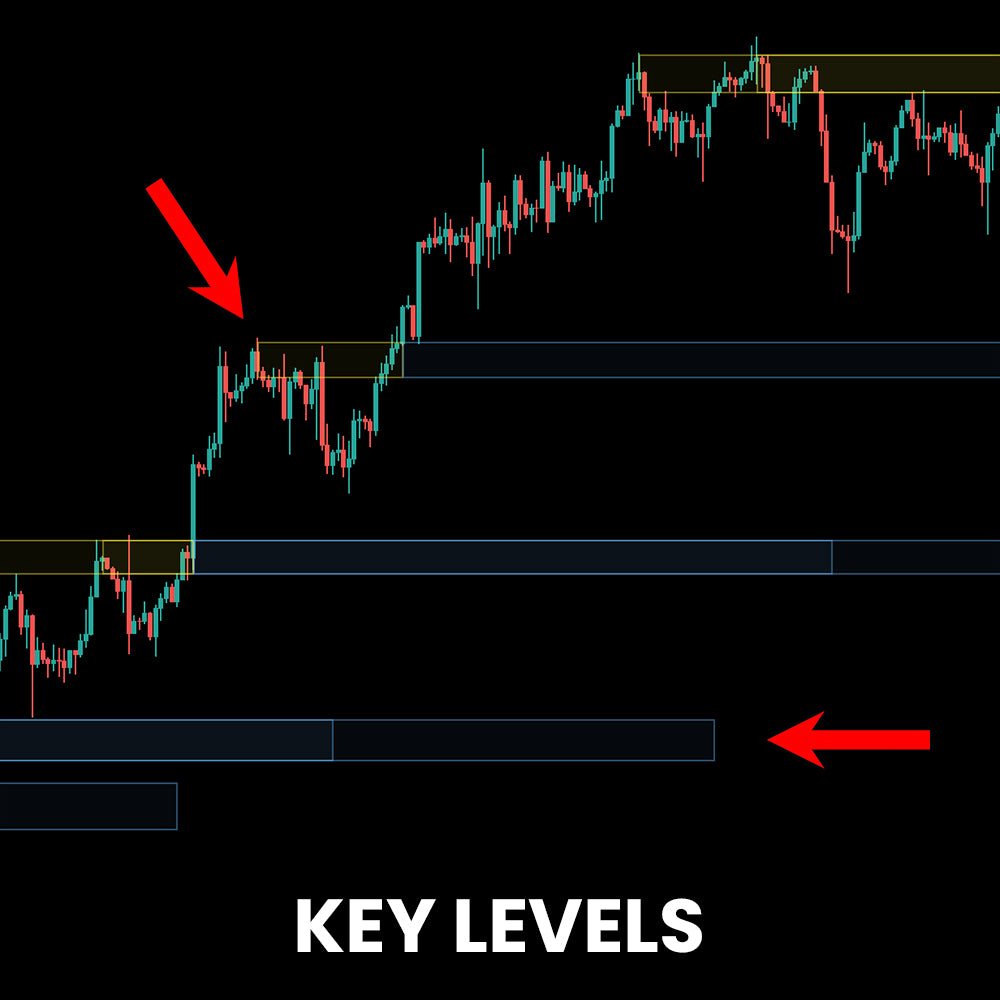
KEY LEVELS
Key levels are established when price touches a level at least three times. The more times the price touches the level, the more significant the level is.Broken lines comes with yellow color and strong lines appear as blue color.
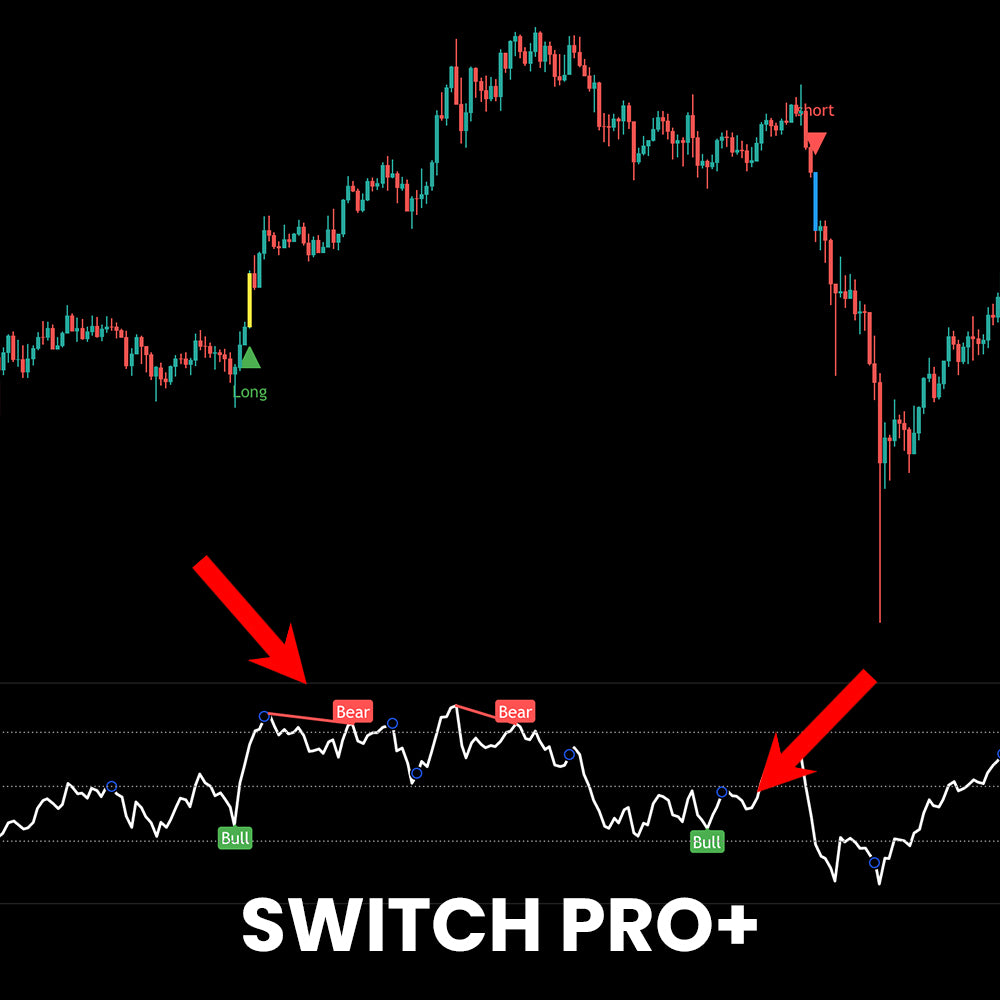
SWITCH PRO+
Switch pro+ can occur between the price of an asset and almost any technical or fundamental indicator or data.Though, Switch pro+ is typically used by technical traders when the price is moving in the opposite direction of a technical indicator.